Features
Monitoring and KPIs
Get the most out of your data
Easily visualize your key performance indicators and make better, data-driven decisions!
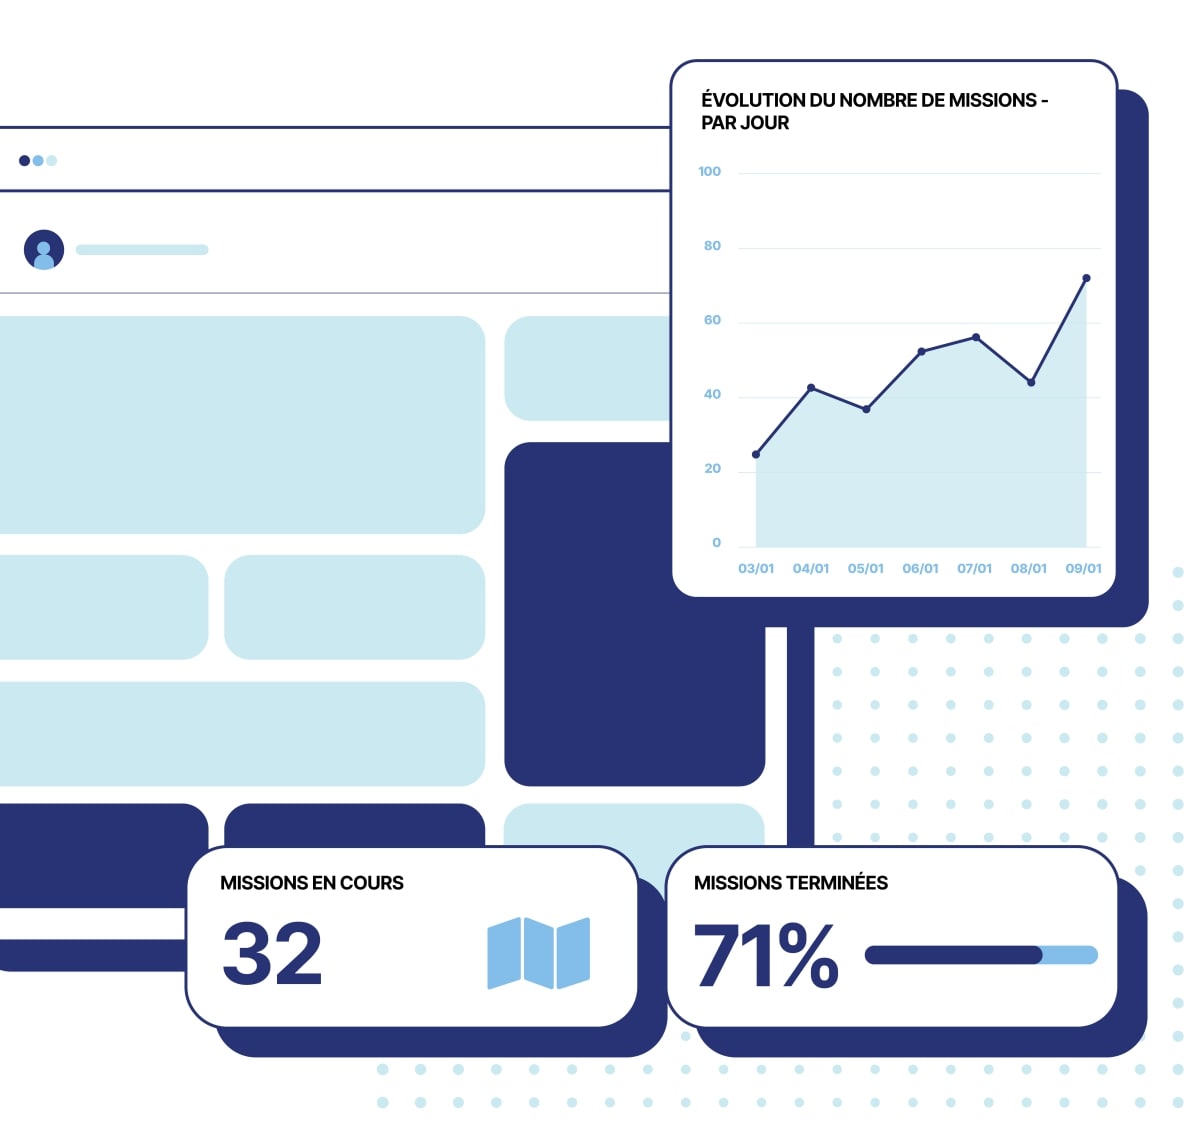
Interactive dashboard
Keep an eye on all your data in real time
Create your personalized dashboard with all the indicators that matter to you updated in real time thanks to a selection of widgets divided by business line.
-
Operational data
-
Customer data
-
Agent data
-
Financial data
-
Quality of service
-
Carbon footprint
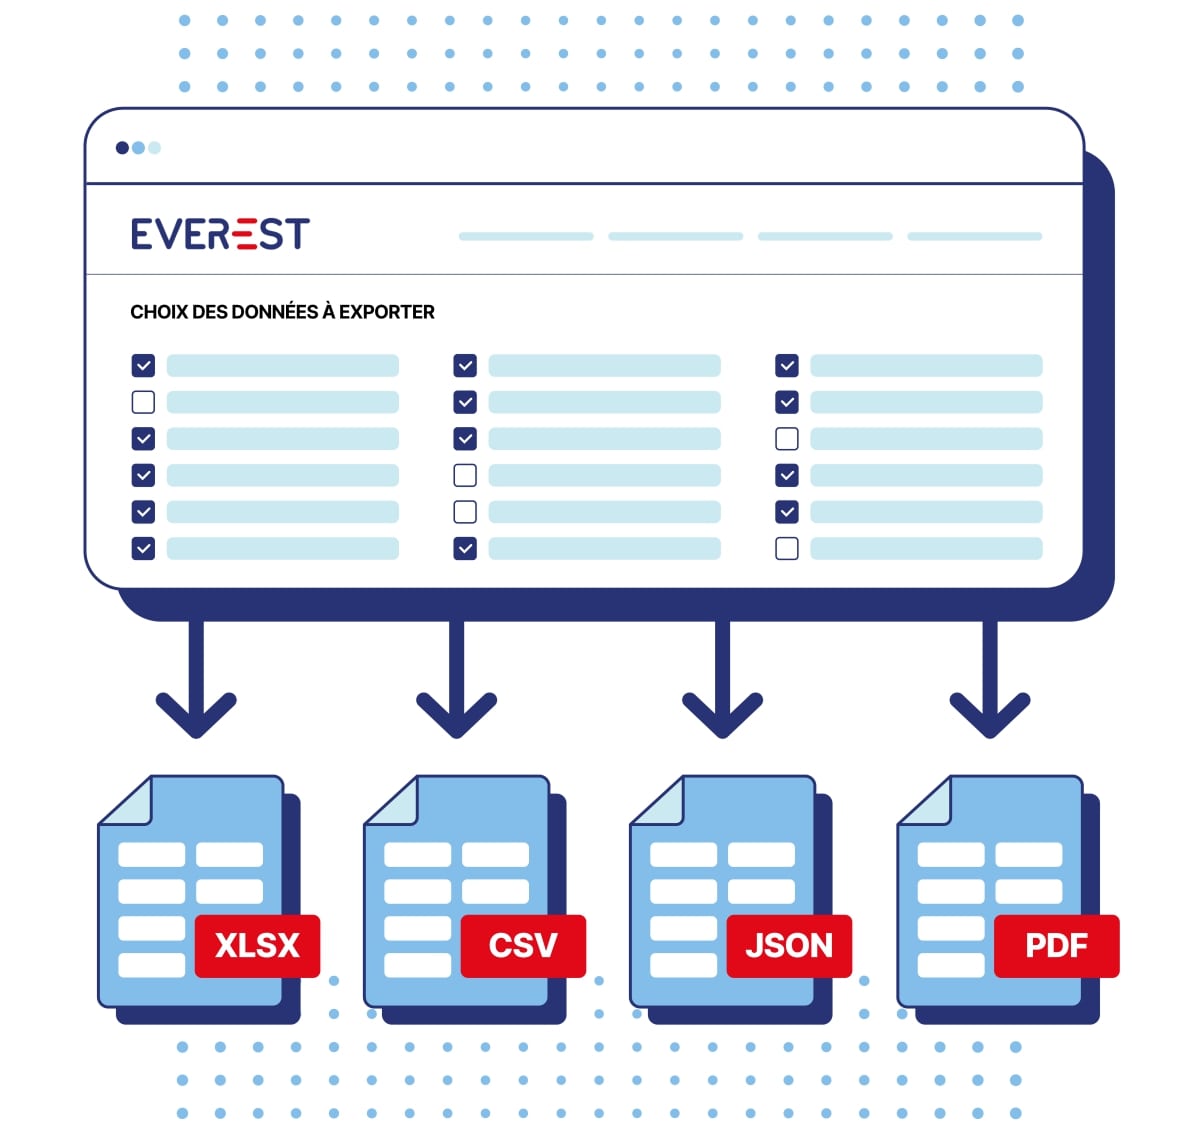
Data export
Create custom reports in just a few clicks
Access a fully configurable reporting tool to export the data you are interested in in the format that suits you best and save your models.
-
Export
-
Your missions
-
Your POD
-
Your invoices
-
Your waybills
-
In format
-
PDF
-
CSV, XLSX
-
JSON
-
Zip
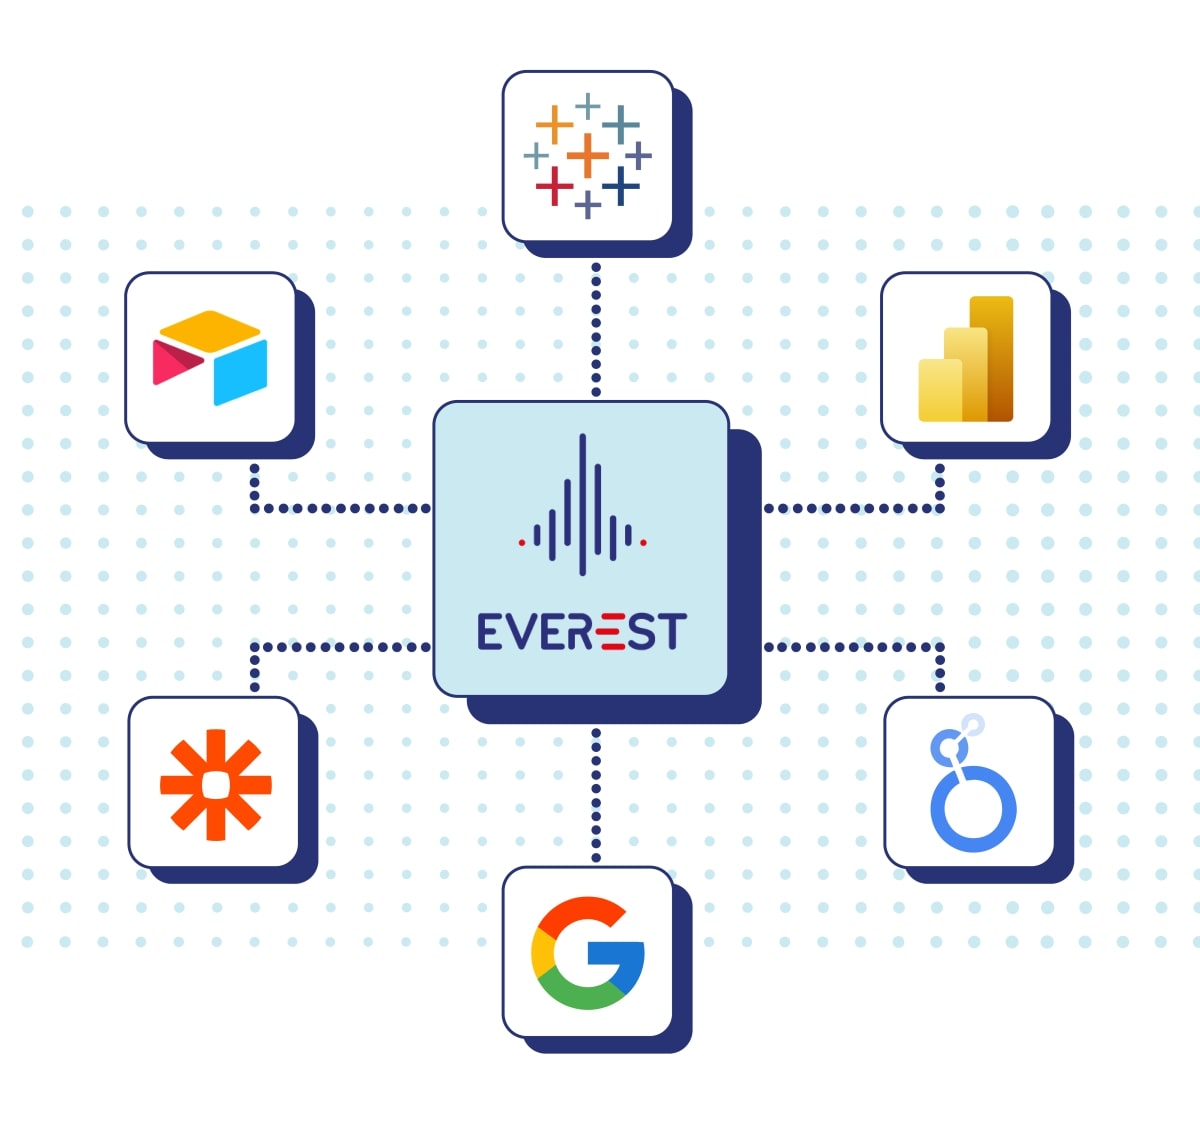
Automations and APIs
Automate sending data to your BI tools
Stop wasting time manually processing your data and create bridges between Everest and your tools to automate information collection.
-
Code or no-code:
-
API
-
Zapier integration
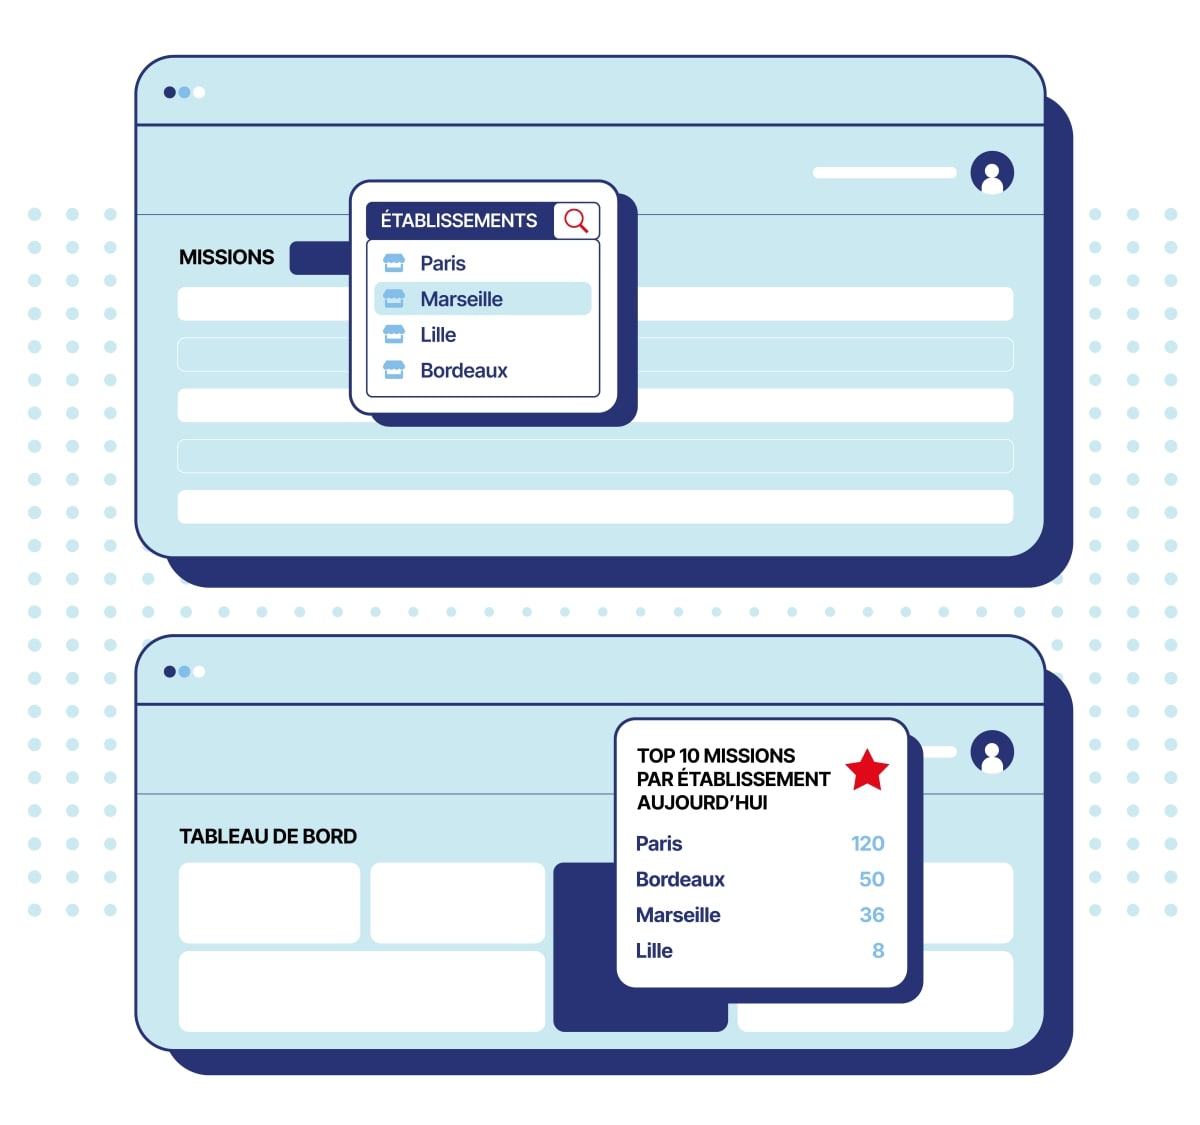
Management of establishments
Do you need a multi-site vision?
Access data from your different establishments and compare their performance easily using dedicated widgets.
-
Gestion des rôles
-
Données d'activité par site
-
Facturation globale ou par établissement
What you should know
What do you have to gain from exploiting your data?
Every organization is different, but here are some examples of quantifiable improvement shared by our clients.

Also read
To learn more about managing a delivery business
Discover our articles, downloadable content and customer cases dedicated to the issue of managing your business.

Calculer sa rentabilité en course à course vs en mise à disposition
Chaque approche présente des avantages et des limites. Cet article compare ces deux modèles pour vous aider à choisir celui qui convient le mieux à votre activité et à vos clients.
Read article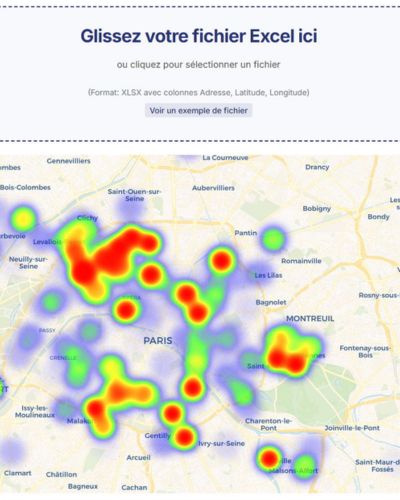
Créez facilement une heatmap de vos zones les plus livrées
En quelques clics, visualisez vos zones de forte activité et identifiez les secteurs sous-exploités pour maximiser votre efficacité opérationnelle.
Read article
Discover the testimony of Brigitte Dumont, Head of logistics platforms outside France at EOL
Find out how EOL managed to equip its teams, digitize its processes, and harmonize its supply chain across six European countries and three different languages using new delivery software.
See the caseFAQ
Do you have a question?
We probably have the answer here
Everest's dashboard is fully customizable with a wide range of widgets. You can display your key KPIs, such as delivery counts, delays, or carbon emissions, in real time. Simply choose the metrics that matter to you and organize them however you like to get a clear, instant view of your business.
Absolutely! Everest lets you create custom export templates to extract the most relevant data for your team or partners. You can export your data to Excel or CSV in just a few clicks, making it easier to analyze and share information.
Yes, Everest is compatible with your business intelligence tools. Through our API or Zapier, you can connect Everest to platforms like Power BI, Tableau, or Google Data Studio to perform in-depth analyses and cross-reference your data with other sources.
Of course, you get technical support with your subscription. We won't do the integration for you, but we can guide you through it.
Yes, this is one of the only additional options that impact the price of your subscription.
Request a demo
To enhance your data,
schedule a demo now!
Discover how Everest can help you better manage your deliveries and gain insight into your operations.